





Last updated: June 2026
Rankings on ToProxyLab are not random numbers. They are the result of a rigorous process: we buy every proxy service with our own money, run it through standardized technical tests, and publish the results. No provider pays for placement. No free accounts are accepted. This page explains exactly how we do it.
The Rating Formula
Every service receives a final score from 0 to 5, calculated using a hybrid model:
R = (E x 80%) + (U x 20%)
R – Final Service Rating | E – Expert Assessment (our technical tests) | U – User Rating (community feedback from verified reviews on our site).
The Expert Assessment (E) is itself a weighted average of five parameters, each scored from 0 to 5 using the rubrics published below. This means every number in our reviews can be traced back to a defined threshold, not a subjective impression.
Expert Assessment: What We Test (80% of the score)
We manually verify each provider against 5 key parameters. We purchase proxy plans as a regular customer (“mystery shopper” approach), run automated test scripts, and cross-check provider claims against real performance data. Each parameter is scored 0-5 according to the rubric attached to it.
1. Speed and Latency (weight: 25%)
Speed is the parameter most often misrepresented by a single lucky number. Running one proxy through Speedtest.net tells you how one exit node performed at one moment – it says nothing about the pool as a whole. So instead of testing one IP, we measure throughput across a sample of 50-200 proxies from the provider’s pool in a single automated run and report the distribution, not a cherry-picked peak. This gives a far more honest picture: a pool can have a few fast nodes and a long tail of slow ones, and only a batch measurement reveals that.
For every proxy in the sample our script measures three things and writes them to a CSV: download throughput (Mbps) by pulling a fixed-size test file and dividing bytes by time, upload throughput (Mbps) by posting a fixed-size payload, and per-request latency (ms). From the full sample we then compute the average, median, minimum and maximum for both download and upload, plus median latency. We always publish the median alongside the average, because on residential pools the two often differ sharply – a high average hidden by a low median is itself a red flag about consistency. Tests run from two locations: a EU server (Germany) and a US server (North Carolina). Uptime is monitored separately over a 24-hour period with requests every 60 seconds. Any pool whose median download drops below the thresholds in the rubric, or whose uptime falls under 95%, receives a penalty.
Why a sample and not one IP. Testing 50-200 proxies instead of one removes the single biggest source of distortion in speed reviews. A provider could hand a reviewer one fast IP and look excellent; a batch run across the pool cannot be gamed that way. It also surfaces the real-world experience: the median of the sample is what a typical user actually gets, and the spread between minimum and maximum shows how consistent the service is. We keep concurrency deliberately low (5-10 parallel connections) during the speed run so that the proxies do not compete for our own server’s bandwidth and deflate each other’s numbers.
Scoring rubric (download speed, based on the sample median):
| Result (median across the sample) | Score |
|---|---|
| > 50 Mbps, avg latency < 500ms | 5 – Excellent |
| 20-50 Mbps, avg < 1000ms | 4 – Good |
| 10-20 Mbps, avg < 2000ms | 3 – Acceptable |
| 5-10 Mbps, avg < 3000ms | 2 – Weak |
| < 5 Mbps or avg > 3000ms or uptime < 95% | 1 – Poor |
Tools used: custom Python script (Python 3.12, asyncio + aiohttp + aiohttp-socks) measuring download/upload/latency across the whole sample, Cloudflare Speed Test endpoints (fixed-size up/down targets), with Speedtest.net and Fast.com used only for spot-checking individual IPs.
2. Anonymity and Leak Detection (weight: 25%)
Every proxy is checked for DNS leaks, WebRTC leaks, and HTTP header leaks. We verify whether the proxy is detected as a proxy, VPN, or datacenter IP by third-party scanners. We also check the Fraud Score, which indicates how likely the IP is to be associated with fraudulent activity. The scoring rubric below shows exactly how a Fraud Score translates into points.
Fraud Score scoring rubric (Scamalytics, median across 5-10 IPs):
| Fraud Score (median) | Interpretation | Score |
|---|---|---|
| 0-15 | Clean – typical of quality residential/ISP IPs | 5 – Excellent |
| 16-30 | Acceptable – minor risk, fine for most tasks | 4 – Good |
| 31-50 | Elevated – usable for scraping, risky for social/payments | 3 – Acceptable |
| 51-75 | High – frequent CAPTCHAs and blocks expected | 2 – Weak |
| 76-100 | Critical – flagged as fraudulent, avoid for sensitive use | 1 – Poor |
DNS, WebRTC, and HTTP header leaks are scored separately on a Pass/Fail basis – a single confirmed leak caps the anonymity sub-score at 2/5 regardless of Fraud Score, because a leak defeats the purpose of using a proxy at all.
Handling false positives and false negatives. Fraud Score tools are not infallible. A genuinely clean residential IP can be flagged simply because a previous user on the same /24 subnet was abusive (a false positive), and a fresh datacenter IP can occasionally pass undetected before databases catch up (a false negative). To reduce this noise we never judge a provider on a single IP: we pull 5-10 addresses from the pool and use the median Fraud Score, not the worst or best outlier. If results are inconsistent across the sample (for example, three IPs at 0 and one at 80), we note this variance explicitly in the review rather than averaging it away, because pool consistency is itself a quality signal. We also cross-check every Fraud Score against a second source (iphey.com / pixelscan.net) so that a single tool’s misclassification does not decide the rating.
Clean residential IPs typically score 0-15; datacenter IPs often score 30-100.
Tools used: Scamalytics (Fraud Score), Spamhaus (blacklist check), whoer.net (anonymity and disguise level), iphey.com (fingerprint and fraud analysis), pixelscan.net (proxy detection and browser fingerprint), ipleak.net (DNS/WebRTC leak test), ip2location.com (IP type classification: ISP, DCH, residential).
3. IP Pool Quality and Coverage (weight: 20%)
We evaluate the actual size of the IP pool (not just the number claimed by the provider), the number of available GEO locations, and subnet diversity. We request 100-500 rotating IPs and check how many unique /24 subnets they cover. A larger number of subnets means less risk of mass bans. We also verify that the GEOs advertised by the provider match the real location reported by ip2location.com.
Scoring rubric (subnet diversity from a 300-IP sample):
| Unique /24 subnets | GEO accuracy | Score |
|---|---|---|
| > 250 unique | > 95% match | 5 – Excellent |
| 150-250 unique | 90-95% match | 4 – Good |
| 80-150 unique | 80-90% match | 3 – Acceptable |
| 40-80 unique | 70-80% match | 2 – Weak |
| < 40 unique | < 70% match | 1 – Poor |
Tools used: ip2location.com, MaxMind GeoIP2, custom Python script (Python 3.12) for subnet analysis.
4. Pricing and Value (weight: 15%)
We compare the price per GB (residential/mobile) or price per IP (datacenter/ISP) against the quality of service delivered. We check the availability of short-term plans (1-3 days), pay-as-you-go models, free trials, and the refund policy. A provider that charges $8/GB but delivers Fraud Score 0 and 95% success rate may score higher than a provider at $3/GB with Fraud Score 40 and 78% success rate.
Scoring rubric (value = price relative to measured quality):
| Value profile | Score |
|---|---|
| Below-market price + high quality + flexible plans (PAYG, trial) | 5 – Excellent |
| Fair price for the quality delivered, trial available | 4 – Good |
| Average price, quality matches, limited flexibility | 3 – Acceptable |
| Overpriced for the quality, or rigid subscription-only | 2 – Weak |
| Expensive and underdelivers, no trial or refund | 1 – Poor |
5. Customer Support (weight: 15%)
We contact support as a new customer with a basic question (“I need proxies for web scraping, which plan do you recommend?”) and a technical question (“My proxy shows a DNS leak, can you help?”). We measure first response time, whether we reach a human or a bot, and the technical accuracy of the response. Providers with 24/7 live chat and sub-5-minute human response times score highest.
Scoring rubric (support):
| First human response + accuracy | Score |
|---|---|
| < 5 min, 24/7, technically accurate answer | 5 – Excellent |
| < 30 min, accurate answer | 4 – Good |
| < 2 hours, mostly accurate | 3 – Acceptable |
| > 2 hours or bot-only with weak answers | 2 – Weak |
| No human reachable / inaccurate / no response in 24h | 1 – Poor |
Testing Environment
All tests are conducted from two dedicated VPS servers to ensure consistent and reproducible results:
| Parameter | EU Server | US Server |
|---|---|---|
| Location | Hub Europe (Germany) | North Carolina, USA |
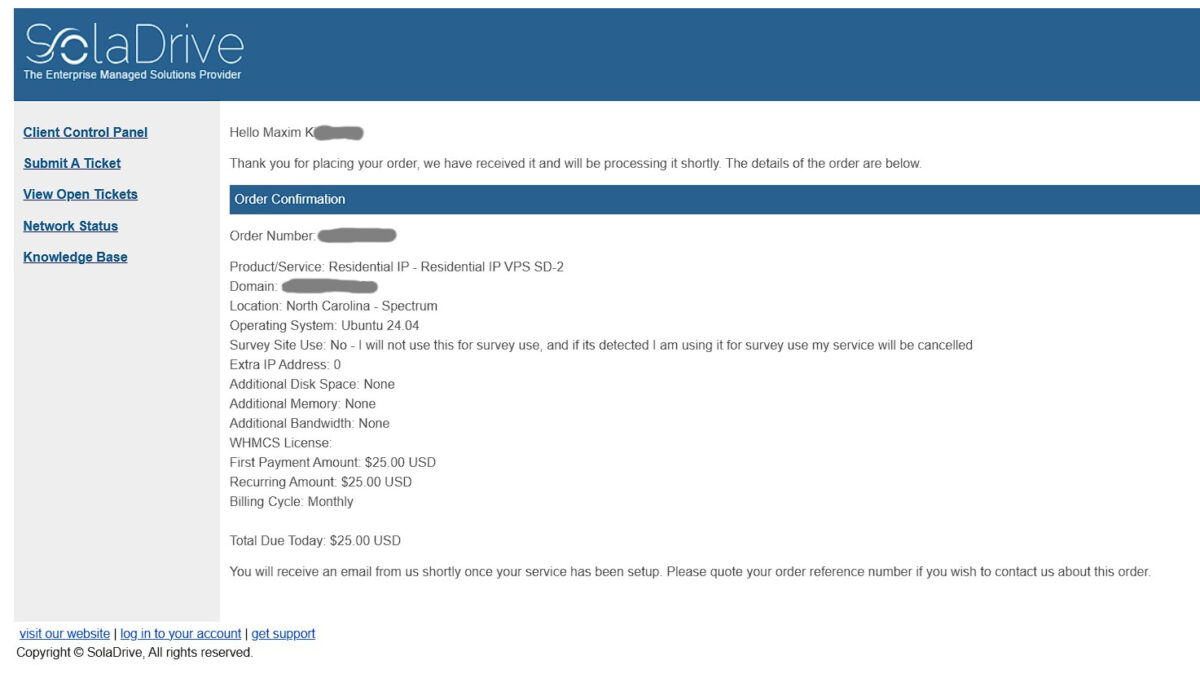
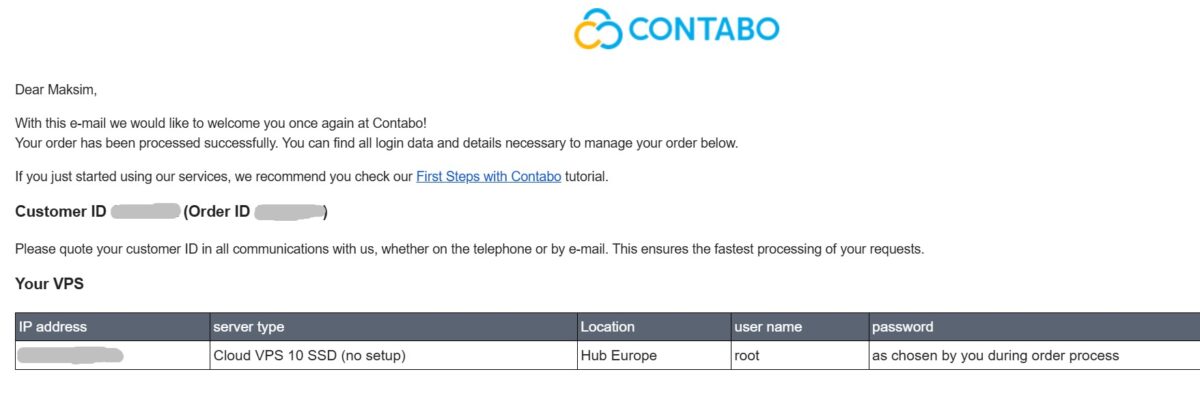
| Provider | Contabo | SolaDrive |
| Type | Cloud VPS 10 SSD | Residential IP VPS SD-2 |
| OS | Ubuntu 24.04 LTS | Ubuntu 24.04 LTS |
| Connection | 1 Gbps | 1 Gbps |
| Test toolchain | curl 8.5.0, Python 3.12, GNU parallel | curl 8.5.0, Python 3.12, GNU parallel |
| Purpose | EU/Global proxy tests | US proxy tests |
Browser-based tests (whoer.net, pixelscan.net, iphey.com) are conducted manually using a clean Chrome profile or via Dolphin{anty} anti-detect browser (latest stable build) with default fingerprint settings.
Reproducibility and Outlier Handling
We guard against distorted ratings on two fronts: variation over time and variation across the pool. For time, every speed and latency test is run multiple times across different times of day where provider access allows (typically morning, afternoon, and evening in the target timezone), and we report the median of those runs rather than a one-off best case. For the pool itself, our speed and success-rate tests now measure a sample of 50-200 proxies in a single run instead of one IP, so the figure we publish is the median of the whole sample – a number that cannot be inflated by one fast node handed to a reviewer. We always report the average alongside the median (and the minimum and maximum where relevant) so that a handful of slow proxies cannot hide behind a flattering average, and so that the spread within a pool is visible rather than smoothed away. Where we have enough request volume, we additionally compute P95 latency to show worst-case behaviour.
To keep batch measurements honest, we hold concurrency deliberately low during throughput tests (5-10 parallel connections) so the proxies do not compete for our own server’s bandwidth and deflate each other’s numbers, and we separate genuine proxy failures from external causes – a request that fails because a free IP-intelligence endpoint rate-limited us, or because a transfer hit our timeout rather than the proxy itself, is never counted against the provider. If any run deviates sharply from the others we discard it and re-test, and we flag providers whose results are unstable across runs or highly inconsistent across the pool – inconsistency is itself reported as a finding rather than averaged out of existence.
Testing Process in Practice
Step 1: Purchase
We register on the provider’s website as a regular customer using a personal email and pay with our own card. No promo codes from the provider, no special deals. The goal is to get the same experience as any new user. Below is an example of a standard order confirmation:
Step 2: Terminal Testing
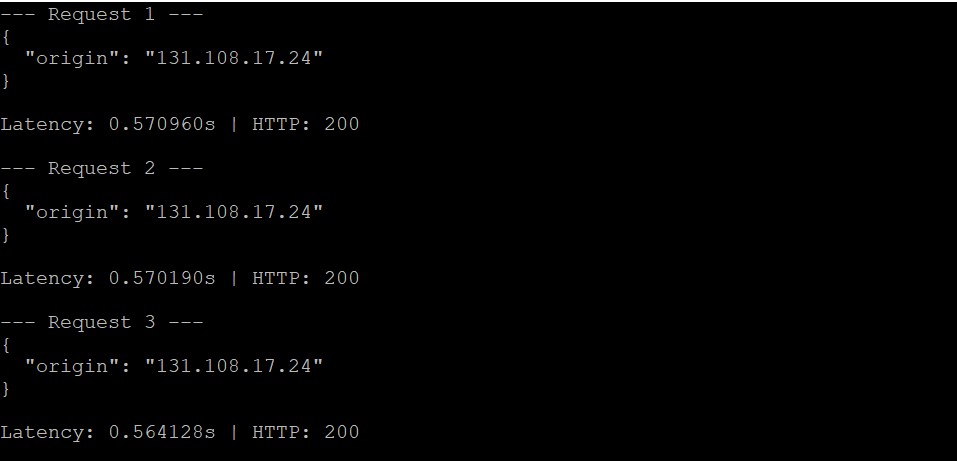
Once we receive proxy credentials, we connect to our test VPS via SSH and run the curl-based latency script. A typical test session sends 500-1000 requests through the proxy (both single-threaded and at 50 concurrent connections) and logs response time, HTTP status code, and the returned IP for each request. Here is what a live test session looks like:
Step 2b: Automated Pool Run (Success Rate, Latency Percentiles, IP Uniqueness)
Single requests tell you whether a proxy works; they do not tell you how a whole pool behaves under repeated use. To capture that, we run a dedicated Python script (Python 3.12, asyncio + aiohttp) that fires a large batch of requests through the provider’s pool and records four things for every single request: whether it succeeded (HTTP 2xx), how long it took in milliseconds, the exact exit IP that was returned, and the geolocation and IP-type classification of that exit IP. This turns vague claims like “huge clean residential pool” into hard numbers we can publish.
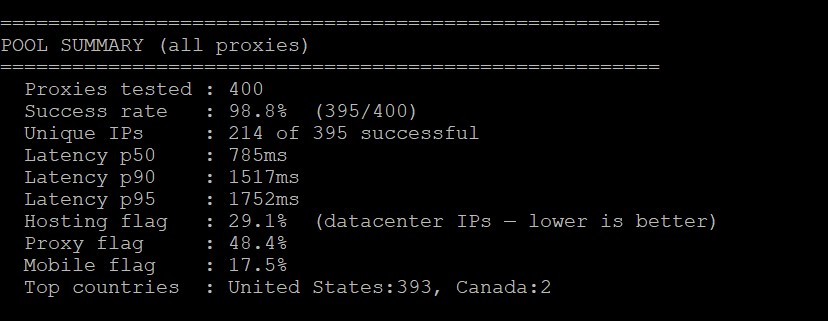
The script reports three pool-level metrics that the per-request curl test cannot show on its own:
- Pool success rate – the share of all requests that returned a valid response. A gateway that drops 1 in 10 connections is far less usable than its marketing suggests, and this number exposes it immediately.
- Latency percentiles (p50 / p90 / p95) – not just the average. The median (p50) shows typical speed, while p90 and p95 reveal the “slow tail.” A pool with a p50 of 700ms but a p95 of 6000ms is unstable, and that gap is something an average alone would hide.
- Real IP uniqueness – how many distinct exit IPs the pool actually returned across all successful requests. If 200 requests yield only 136 unique IPs, the pool is recycling addresses far sooner than a provider claiming “millions of IPs” would have you believe.
Scoring rubric (pool success rate + IP uniqueness):
| Success rate | Unique IPs (of successful requests) | Score |
|---|---|---|
| ≥ 99% | > 95% unique | 5 – Excellent |
| 97-99% | 85-95% unique | 4 – Good |
| 93-97% | 70-85% unique | 3 – Acceptable |
| 85-93% | 50-70% unique | 2 – Weak |
| < 85% | < 50% unique | 1 – Poor |
This sub-score feeds into both Speed and Latency (via the success rate and percentile data) and IP Pool Quality and Coverage (via the uniqueness data), giving those two parameters a measured backbone instead of relying on the provider’s own figures.
Cross-checking IP type at scale. The same run also classifies every exit IP as residential, datacenter (hosting), or mobile using an IP-intelligence source. This matters because a service sold as “residential” can quietly mix in datacenter addresses, and a single spot-check would never catch it. By classifying the whole batch we can report, for example, “24.6% of exit IPs were flagged as datacenter” – a figure that directly contradicts a residential claim and lowers the score accordingly. As with Fraud Score, we treat any single database as fallible and confirm a high datacenter share against a second source (ip2location.com) before it affects the rating.
A note on rate limits and honesty of the number. Free IP-intelligence endpoints throttle requests, so a failed lookup is not the same as a failed proxy. Our script separates network/proxy errors from classification-service errors, and we never count a geolocation rate-limit against the provider’s success rate. The success rate we publish reflects the proxy’s performance only.
Tools used: custom Python script (Python 3.12, asyncio + aiohttp + aiohttp-socks), ip-api.com and ip2location.com (exit-IP geolocation and type classification), CSV export for the full per-request log.
Step 2c: Pool-Wide Speed Test (Download / Upload / Latency)
In the same session we run a second script dedicated to throughput. Rather than putting one IP through a browser speed test, it pulls a fixed-size file and posts a fixed-size payload through 50-200 proxies from the pool, timing each transfer to calculate download and upload speed in Mbps. The output is a single summary – tested vs. successful count, average and median download, average and median upload, fastest and slowest node, and median latency – backed by a per-proxy CSV. Here is what a finished run looks like:
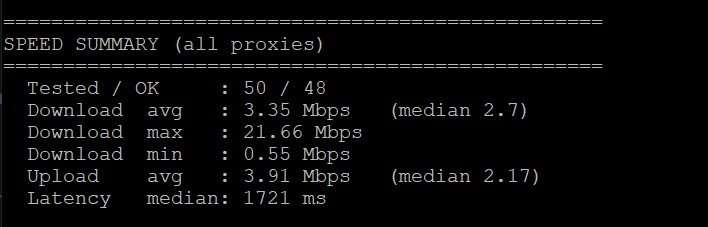
The gap between the maximum and the median is as informative as the headline figure. A pool that peaks at 21 Mbps but has a median of 2.7 Mbps is not a “fast” pool – most users will see the median, and we score it accordingly. Because this run downloads and uploads real data, it also doubles as a practical check on a trial plan’s traffic limit: if a sample exhausts the allowance, that constraint goes straight into the review.
Step 3: Fraud Score and Blacklist Check
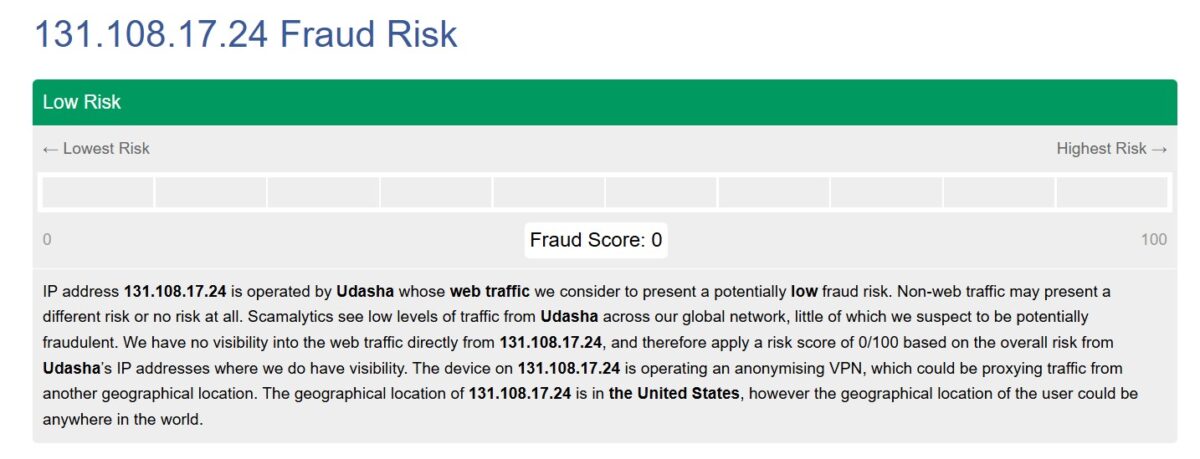
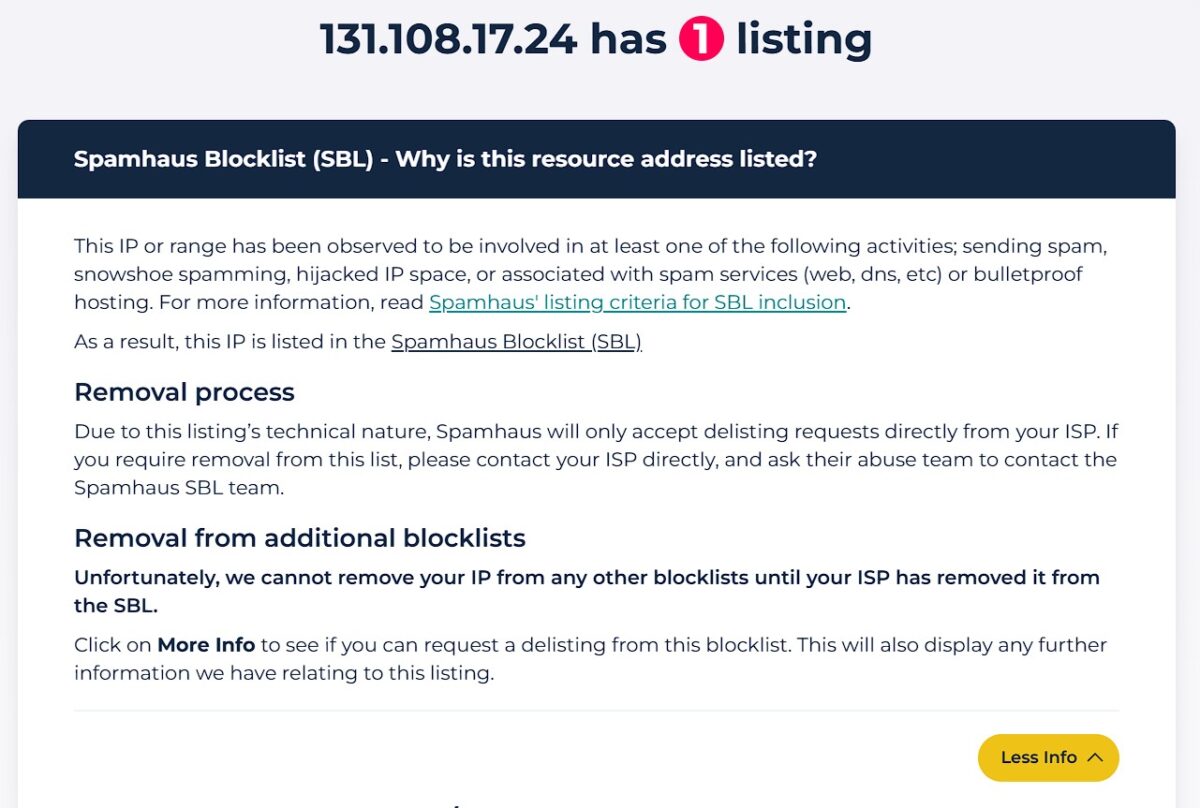
We take 5-10 IPs from the provider’s pool and check each one on Scamalytics and Spamhaus. We record the Fraud Score (0-100) per IP, take the median across the sample, and note any variance. We also log whether each IP appears on any blacklist. These screenshots go directly into the review:
Step 4: Browser-Based Verification
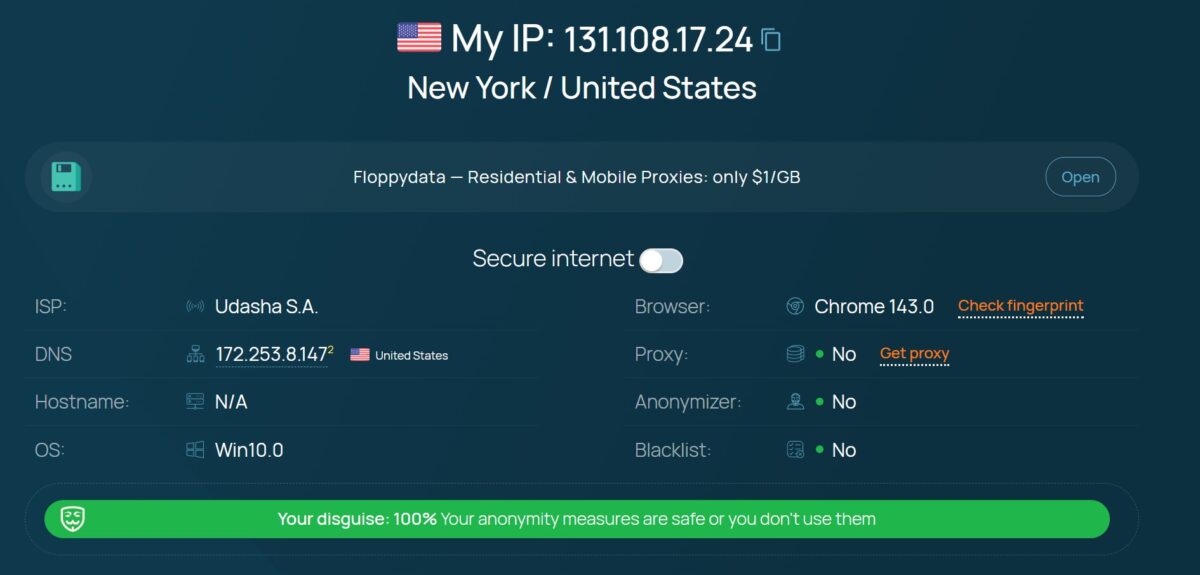
We open a clean Dolphin{anty} profile with default fingerprint settings and visit whoer.net, iphey.com, and pixelscan.net through the proxy. This checks for DNS leaks, WebRTC leaks, and whether the IP is detected as a proxy or datacenter address:
Step 5: Scraping Success Rate
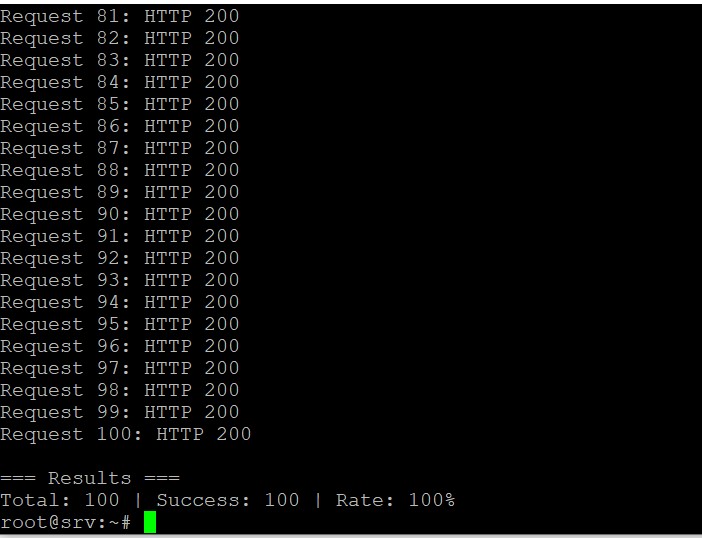
We run 1000 requests to Google Search and Amazon product pages through the proxy and count successful responses (HTTP 200). The success rate is calculated as a percentage. Anything below 80% is a red flag for scraping use cases. We always publish the sample size alongside the percentage (e.g. “85.71% on 5,319 requests”) so the figure can be judged in context:
Sample Raw Output
Here is an example of what our raw CSV test log looks like for a single provider:
request_id,timestamp,proxy_ip,latency_ms,http_status,target
001,2026-02-20T10:00:01,131.108.17.24,570,200,google.com
002,2026-02-20T10:00:02,131.108.17.24,570,200,google.com
003,2026-02-20T10:00:03,131.108.17.24,564,200,google.com
004,2026-02-20T10:00:04,131.108.17.24,558,200,google.com
005,2026-02-20T10:00:05,131.108.17.24,572,200,google.com
006,2026-02-20T10:00:06,131.108.17.24,561,200,google.com
007,2026-02-20T10:00:07,131.108.17.24,569,200,google.com
008,2026-02-20T10:00:08,131.108.17.24,555,200,google.com
009,2026-02-20T10:00:09,131.108.17.24,573,200,google.com
010,2026-02-20T10:00:10,131.108.17.24,566,200,google.com
Full CSV exports are available upon request at editor@toproxylab.com.
Metrics We Record for Every Provider
| Metric | How we measure it | Tool |
|---|---|---|
| Download speed (Mbps) | Average + median across a 50-200 proxy sample, fixed-size file per proxy | Custom Python script (asyncio) |
| Upload speed (Mbps) | Average + median across the same sample, fixed-size payload per proxy | Custom Python script (asyncio) |
| Latency (ms) | Min / Avg always; Median / P95 where test volume allows, across 500-1000 requests | curl timing script |
| Uptime (%) | Requests every 60s for 24h, % successful | Custom monitoring script |
| Fraud Score | Median score 0-100 across 5-10 tested IPs | Scamalytics |
| Blacklist hits | Number of databases flagging the IP (out of 80+) | Spamhaus, MX Toolbox |
| DNS leak | Pass/Fail | ipleak.net |
| WebRTC leak | Pass/Fail | ipleak.net |
| Proxy detected | Yes/No + detection type | whoer.net, pixelscan.net |
| IP type (ISP/DCH/Residential) | Classification by IP intelligence database | ip2location.com |
| Unique subnets (/24) | Count from 100-500 rotated IPs | Custom Python script |
| GEO accuracy | Claimed vs. actual location match | ip2location.com, MaxMind |
| Support response time | Minutes from first message to human reply | Manual test |
| Scraping success rate (%) | % of 200 OK responses out of 1000 requests to Google/Amazon | curl loop script |
| Pool success rate (%) | % of valid responses across a 200-1000 request automated batch | Custom Python script (asyncio) |
| Latency percentiles (p50/p90/p95) | Distribution of response times across the full batch | Custom Python script (asyncio) |
| Real IP uniqueness | Distinct exit IPs as a share of successful requests | Custom Python script (asyncio) |
| Exit-IP type at scale | % residential / datacenter / mobile across the full batch | ip-api.com, ip2location.com |
Comparative Results Across Tested Providers
Single numbers are easy to cherry-pick, so we publish our key verified metrics side by side. The table below compares scraping success rate (with the exact sample size), median Fraud Score, and measured download speed across the providers in our current ranking, all gathered under the same conditions described above. This makes it easy to see how a provider performs relative to the field, not just in isolation.
| Provider | Success rate (sample) | Median Fraud Score | Measured speed | Proxy detected? |
|---|---|---|---|---|
| NodeMaven | 100% (25+ req, FOGLDN) | 0/100 | 8.6-9.8 Mbps | No |
| MobileProxy.Space | ~98% (stress test, 100 threads) | 1/100 | 4-8 Mbps | No |
| Proxy6 | ~95% (datacenter) | 0/100 | 10 Mbps | No |
| IPRoyal | ~94% (mobile) | ~10/100 | 15-20 Mbps | Partial flags |
| Proxy-Seller | 92.3% (1,000 req) | 0/100 | n/a | No |
| Oxylabs (trial DC) | ~90% (datacenter) | 50-100/100 | 10-12 Mbps | Yes |
| Proxys.io | ~90% (residential) | 21/100 | 11.8 Mbps | No |
| NetNut | 85.71% (5,319 req) | 12-16/100 | 5.9-7.8 Mbps | No |
Every figure above is taken directly from our recorded test data for each provider; full per-provider breakdowns are published in the individual reviews. We do not list median or P95 latency in this comparison table because we do not capture those metrics for every provider on every test cycle – where they exist, they are reported inside the relevant individual review rather than implied across the board here. Figures reflect the most recent test cycle and are re-measured on the schedule below.
User Rating: How Community Feedback Works (20% of the score)
20% of each provider’s score comes from verified user reviews submitted on our website. We calculate the average score from all approved reviews.
Review Moderation
Every review undergoes manual moderation. We reject reviews that are submitted via temporary email addresses or proxy/VPN IP addresses, contain text copied from other websites, include baseless accusations or spam links, or appear to be paid advertisements. We understand that competitors may attempt to sabotage each other and providers may try to boost their own scores. Our moderation process is designed to prevent both.
Raw Test Data
We believe in full transparency. Each review on ToProxyLab includes specific test results: speed measurements, Fraud Scores, blacklist counts, and screenshots from third-party verification tools. Here is a summary of what we publish in every review:
| Data point | Where published | Example |
|---|---|---|
| Fraud Score per IP | In the review body + screenshot | Oxylabs: Fraud Score 50-100 |
| Blacklist status | In the review body + screenshot | IPRoyal: IPs flagged on Spamhaus |
| Speed test results | In the review body | Proxy6: 10 Mbps measured |
| Whoer.net anonymity | In the review body + screenshot | Proxy-Seller: 100% disguise |
| Scraping success rate | In the review body | NetNut: 85.71% on 5,319 requests |
| Support response time | In the review body | IPRoyal: 20 min on NYE |
If you need access to raw test logs (CSV exports, full curl output, complete Scamalytics/Spamhaus screenshots) for any specific provider review, contact us at editor@toproxylab.com. We provide raw data upon request for fact-checking, research, or journalistic purposes.
Update Schedule
Proxy services change constantly: providers update their infrastructure, adjust pricing, and expand or shrink their IP pools. To keep our data relevant, we follow this update schedule:
| Action | Frequency |
|---|---|
| Full re-test of top 10 providers | Every 3-4 months |
| Price and feature updates | Monthly |
| New provider reviews | As providers launch or gain traction |
| Methodology page updates | When tools or process changes |
The “Updated” date at the top of each review reflects the last time we verified or re-tested the provider’s data.
Independence and Disclosure
ToProxyLab earns revenue through affiliate commissions. This does not influence our rankings or scores. A provider with a generous affiliate program but poor test results will rank below a provider with no affiliate program but strong performance. Full details are available in our Affiliate Disclosure.
All testing is conducted by Max K., founder and lead reviewer of ToProxyLab. Questions about our methodology? Contact editor@toproxylab.com.